Let’s take a little trip back in time…
When I was a kid, I celebrated Thanksgiving with unusual aplomb. Part of it was recognizing the few days off from school as a prelude to a longer winter break, but the memories I hold most dear involve bundling up and taking a post-dinner hike into the woods.
Here I would skirt the tree lines separating farmers’ fields and stomp my way through the snow.
Eventually I’d find myself standing square in the center of a barren field, surrounded by yellow and gray grasses and bordered by leafless trees. Soon I’d hear that goofy and somehow soothing call of Canadian geese flying south towards warmer climates.
We link to vendors to help you find relevant products. If you buy from one of our links, we may earn a commission.
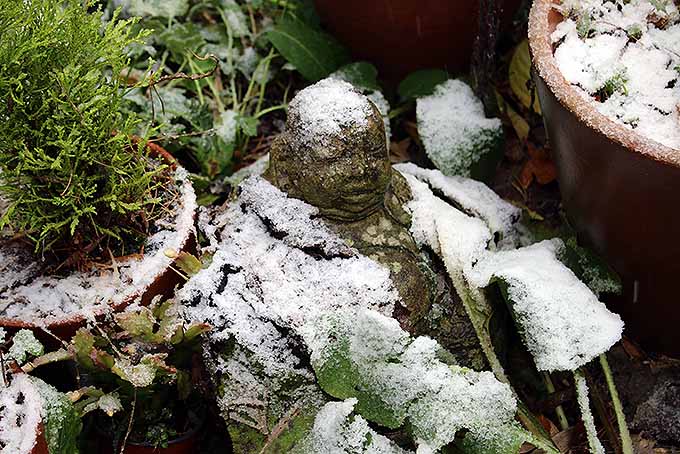
It was a favorite tradition, but it’s a rare happening to see snow on Thanksgiving nowadays. As a gardener, these climatic changes are vital to understanding the evolving state of our yards and our gardens.
Changes in the Garden
Those folks who’ve been gardening since the 2000s and before have probably noticed changes in growing patterns between then and now.
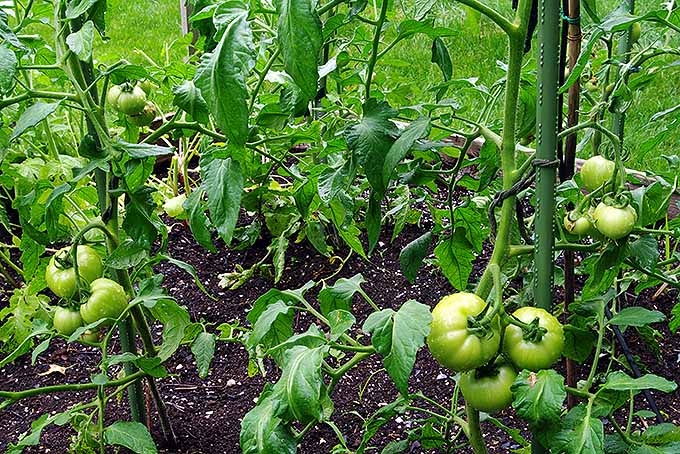
Annuals that ought to be toast by September are blooming through to November. Just a few weeks ago, I witnessed very confused apple trees and forsythia pushing out a late-autumn bloom.
Sometimes it’s a sight of joy and excitement, and other times it’s a disconcerting observation when you’re wondering why your peppers are pushing new flowers in the first week of November. If you’ve seen these changes firsthand, you’re not alone.
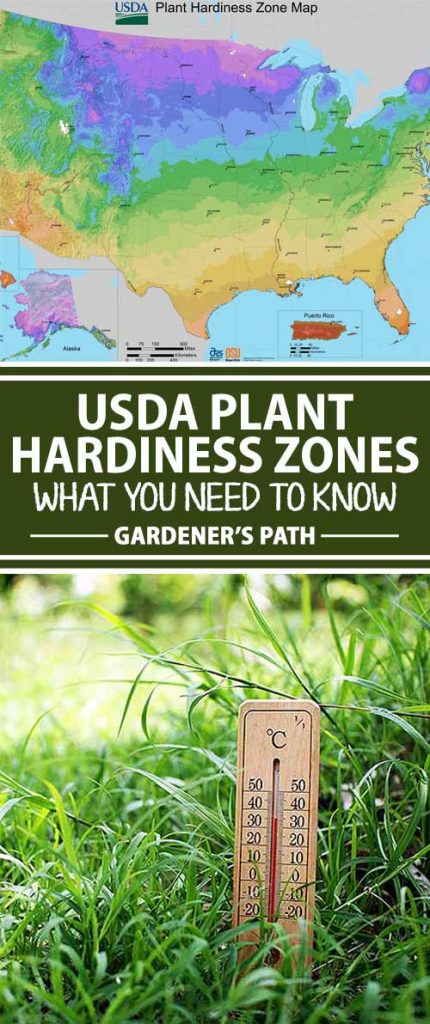
A Look at the USDA Growing Zone Map
The United States Department of Agriculture has been a reliable authority for determining what plants can grow where in the United States. It relies on decades of records of weather patterns to determine the average highs and lows of any specific area.

The USDA Plant Hardiness Zone Map’s origins stretch back to the 1960s, when Henry Skinner of the United States National Arboretum first devised a working map of plant hardiness zones. His original vision has transmuted into the USDA zones we’re familiar with today.
Back in 1990, a growing database of climatic records prompted the first major change to this map, and in 2012 the map was updated again. We haven’t had an update since, and we probably shouldn’t expect one for some time.
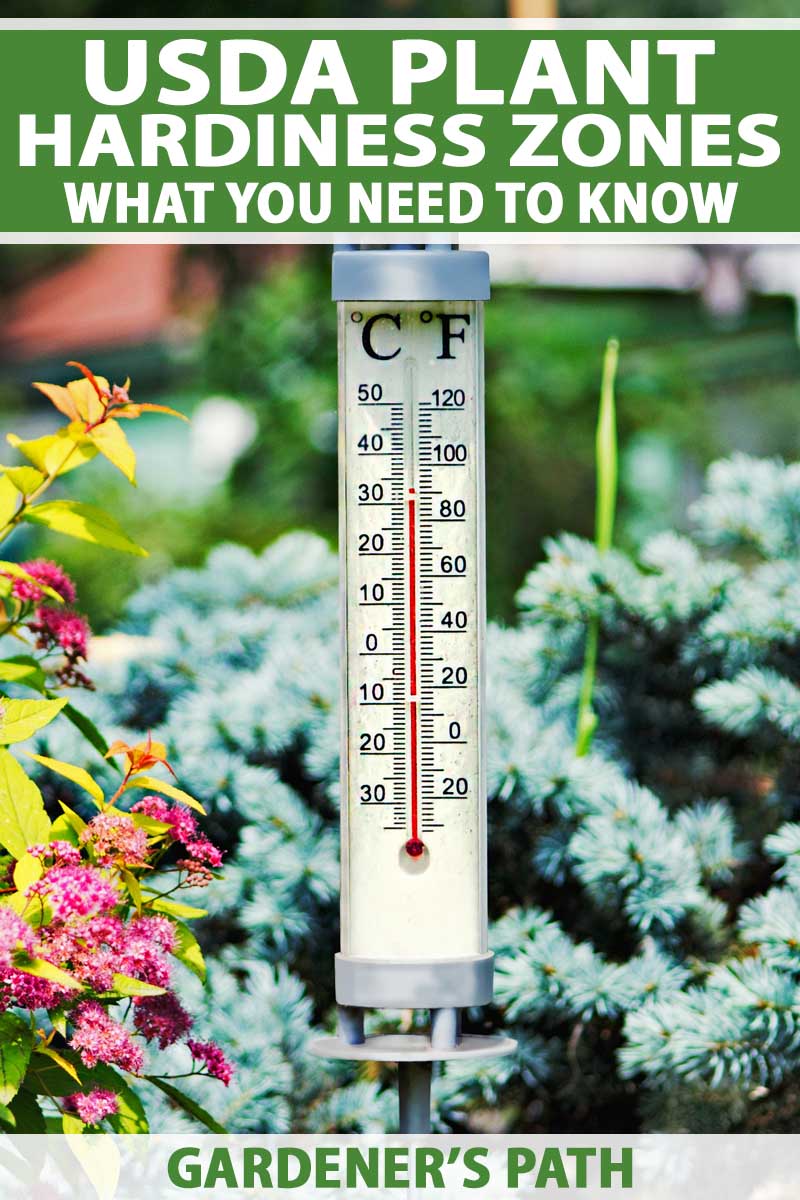
But How Does It Work?
The plant hardiness zone map is separated into regions by average low temperature. The regions range from 1 to 13, with each individual region split into an “a” or “b” category.
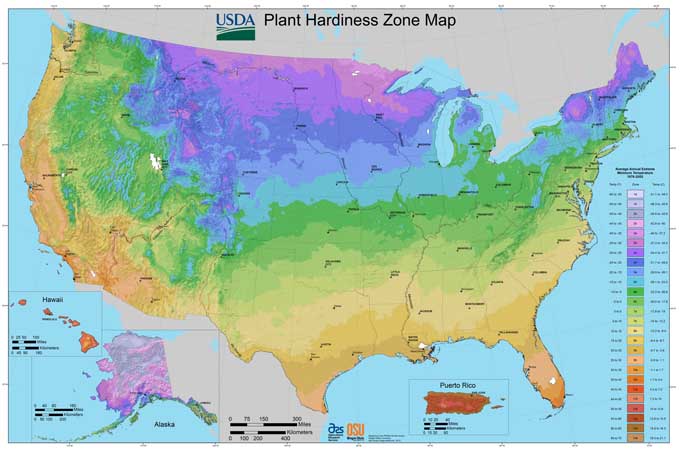
Each digit between 1 and 13 represents a 10-degree difference in the average low temperature, while the “a” or “b” narrows this temperature gap down to 5-degree increments.
For example, Zone 7 has an average low temperature of 0 to 10 degrees Fahrenheit; 7a has a low of 0 to 5 degrees, and 7b has a low of 5 to 10 degrees. Zone 6 has an average low between -10 and 0 degrees, and Zone 8 has an average low between 10 and 20 degrees Fahrenheit.
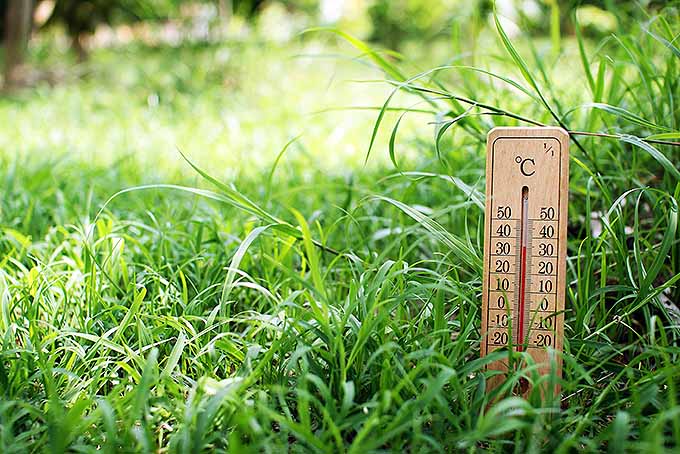
The Climes, They Are A-Changin’
Although our planet is definitely getting warmer, this change in the USDA plant hardiness measurements between 1990 and 2012 is officially attributed to more accurate temperature measurements, and a system that takes into account a location’s closeness to bodies of water, elevation, and other micro-climate effects.
However, just because a 6b in 1990 was relabeled as a 7a in 2012, it doesn’t necessarily indicate that certain plants can now grow in these warmer locations. In some areas, these climactic changes have been more gradual. In others, you can’t help but notice them.
According to an article published in November 2019 in the Anchorage Daily News, these changes and their effects in the garden are undeniable. Gardening columnist Jeff Lowenfels says warming is happening two to three times faster in the Arctic than it is in other places on Earth, and at the time of writing he tracks a 20-month period of record-breaking temperatures. This affects planting times, bloom periods, and everything else, even the way gardeners may need to make adjustments to deal with weeds and newly invasive plants.
If you started your garden before 2012, subtle changes in climate could explain why harvest times and dates of first and last blooms have shifted. And if you’ve been paying close attention to the more sensitive plants in your garden in the heat of summer, or the hardier plants during the winter chill, things may have changed since then as well.
As always, the gardener must take into account the natural habitat of any plant they wish to grow (read more about when full sun doesn’t really mean full sun, for a start). Some plants thrive in hot weather, but also demand a humid and moist environment.
So, the next time you’re shopping for plants and reading the tags like a dutiful gardener, keep in mind that the climes, they are a-changin’.
To see what hardiness zone you live in, visit the USDA Plant Hardiness Zone Map website and pop in your zip code to find out. Keep in mind that the data you’re looking at was analyzed and documented in 2012, and consult your gardening journal as a point of comparison so you can adjust accordingly when planning and planting your first vegetable garden.
What differences have you noted in your garden in the last few years, with the consistently warmer weather, frosts that arrive earlier, or periods of drought or excessive rain? Share in the comments!
Snowy road photo by Matt Suwak, © Ask the Experts, LLC. ALL RIGHTS RESERVED. See our TOS for more details. Uncredited photos: Shutterstock. Last updated November 22, 2019. With additional writing and editing by Allison Sidhu.
Thanks for this good info!
Now that we know we are heading into an ice age, do you have any maps suggesting how the grow seasons will be?
Hi Bonnie! It’s difficult to say exactly how growing seasons will be changing. On average most places in the United States see an increase of two weeks in the growing season, while states on the west coast might have as much as a month of extra growing time. Beyond that I don’t think there’s a definitive answer on what we can expect from future growing seasons. NASA has a great overview on all of this titled “Scientific Consensus” that can offer some in-depth information on climate change in general!
Look up grand solar minimum by John Casey! My grow season this year was a month shorter and I’m in the west! Things really didn’t take off this year like they usually do! Days were okay but nights were colder than normal!
I believe the agricultural climate zones are still extremely inaccurate.
As a hobby, I grow Celosia ‘Kelos Fire’, a so called annual plant here in Long Island, Ny.
For over the last 15 years, my plants do survive the winters. So they should not classify these as annuals anymore.
They not only grow back, each have developed unique features that surpasses the height and shape these flowers develop. One example, this summer a single Celosia bloomed as an exact replica of a minora. Very strange yet fun and exciting.
Hey there Tony, thanks for commenting here. I agree that accuracy can be improved with these maps, but I do think it’s a solid starting point to reference. I’ve had similar experiences with dusty miller, typically perennial in zones 8 to 10, but have had them survive winters as far north as zone 5b. Microclimates and the care of a dedicated gardener can add a lot to a plant’s ability to survive the winters. Very interesting about the celosia ‘Kelos Fire’, those are some handsome plants. I bet the unique features are really lovely, feel free to share a photo… Read more »
Hi Matt, I really like your post and the statement “they are actually a good starting point” for research. Many people claim they are useless because they are not accurate and have to be improved. Actually, I think they can’t be improved to be perfect because there are so many different factors, microclimates, etc. which simply can’t be integrated in a system which will be accurate. It is a simplified system, meaning exactly that – simple. One simply has to know how to use the data, as you said above. I have developed a small tool to do the research,… Read more »
I’m not a gardener (yet), just a forager so far. The map for my region (Northern Louisiana, supposedly 8a) is not at all correct… Temps below 20-25 F here are rare. We may get a couple days in the high-mid teens (F) in a normal winter, almost always I’m February. The average lows they show on the map key are outrageously low.
Hi Matt, Bonnie was correct! We ARE heading into an ice age because the greatest global two-year cooling event of the last century just occurred. From February 2016 to February 2018 (the latest month available) global average temperatures dropped 0.56°C. Statistical cooling outliers garner no media attention. The global average temperature numbers come out monthly. If they show a new hottest year on record, a big increase over the previous month, or a hot day, that’s a story. When they show cooling of any sort—and there have been more cooling months than warming months since anthropogenic warming began—there’s no story.… Read more »
Can you please cite some sources, random commenter?
Cool tool, Steffen!
I don’t know how or why my search of bamboo plants and if they give off a pixie type dust in spring and warming weather.. to a place that sells bamboo (why anyone wud purchase this horrible plant is beyond me) to what climates they grow in.. only to find that over the Betsy Ross bridge into Maple Shade is now zone 7 ? I must be too old…but I thought I was in zone 5 ? Not that Matt or any posters here may have the answer to my original question but please lmk if anyone knows if bamboo… Read more »
Love the “adjusted” Dylan quote.
Wish I could read the map….it’s too small to read the numbers! And I can’t make it larger on my computer!
If you follow the links under the map, you can explore the interactive map for your growing zone in full detail, or download a high resolution map for your area.
Map too small / won’t enlarge
You can follow the link to see the full-size version of the interactive map!
I know some places seem to be warmer but we are going through changes and we are actually going into a cooling trend! ( see John Casey on the grand solar minimum) even with the heat wave in the US this year we also had record lows this summer all over the states, last year we had 21 days in July where we were 100 degrees F or higher, it’s the 7th of August this year and we haven’t yet to reach 100 degrees, August is our hottest month and we are looking at a high of 73 F this… Read more »
Unfortunately solar minimum is a brief, temporary phase in the solar cycle, so any cooling effects we experience will be temporary.
My front lawn went dormant 30 days ago. It did the same thing last year.
My back lawn went dormant too, it happens during the hottest times of the year in my experience, but the roots are alive and kicking!